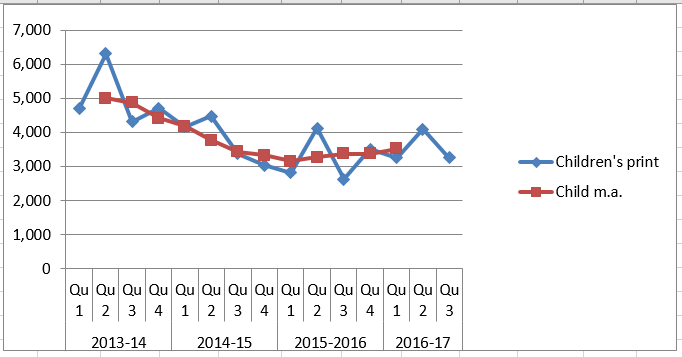
The blue line shows quarterly book issue figures for Greenhill Library. The regular seasonal variation (it peaks every summer) makes it hard to see the underlying trend. The red line is a 4-point moving average which smooths out the seasonal highs and lows. You’ll see that from early 2015 (a few months after the volunteers took over) the downward trend is halted, and even slightly reversed. These figures are for children’s books. Adult issues show less seasonal variation but the overall trend is the same. We must be doing something right!
(Thanks to Liz Coates for this)